Two well-known Ph.D. economists recently published important reports on the condition of printing markets and printing businesses. Naturally, we should ask the question: what do our doctors have to say about the health of our industry?

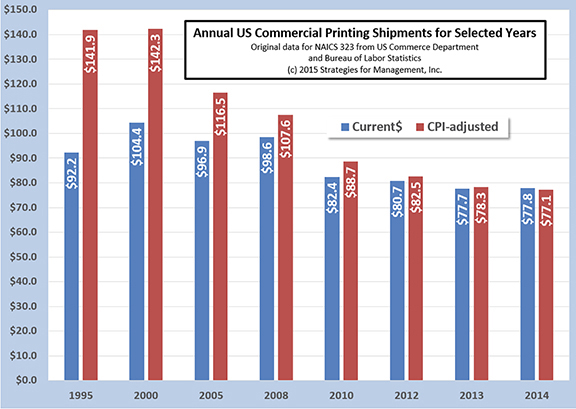
Dr. Joe Webb, with a Ph.D. from the NYU Center for Graphic Communications Management, is director of WhatTheyThink.com’s Economic Research Center. Dr. Webb published a blog on February 4 on current quantitative indicators entitled, “2014 US Commercial Printing Rebounds from Poor First Half with Positive Third and Fourth Quarters.”
After a slow start in 2014, commercial printing shipments finished nearly even with 2013 and with most of the turnaround coming in December. “It was the first positive December since 2010. At that time, however, current shipments were more that $7 billion; December 2014 shipments were nearly $6.52 billion,” Webb wrote.
He deduced that the strong December shipments were most likely the result of print that was generated by:
- The contentious mid-term local and regional election cycle
- A surge in local retail and holiday shopping promotions
However, Dr. Doom—as Joe Webb is sometimes called—had a warning against any false optimism that the December figures were part of a long-term growth trend. He wrote, “It is unlikely that this is a bottoming-out trend of industry shipments patterns, but a marked slowdown in the decline of real shipments. It is likely it is a sideways pause before another shift in media implementation.”
Media implementation refers to corporate marketing strategies that allocate budgets for the different communications channels, i.e. print, TV, radio, mobile, social, etc. There are contending opinions developing at the corporate marketing level regarding the effectiveness of digital approaches (computer, tablet and smartphone) versus tradition print such (direct mail, insert media, etc.).
Finally, Webb gave a warning, “Again, we remind readers that aggregate industry shipment data trends are not the certain destinies of all print businesses. Processes and product offerings are changing as market demands require. Getting ahead of those changes is essential.
“A slowdown in industry contraction, and even short-term increases, should be viewed as breathing room for thoughtful business re-configuration for the future.”

Dr. Ronnie H. Davis, Senior Vice President and Chief Economist at the Printing Industries of America Economic and Market Research Department published the second report called, “Industry Briefing: Competing in Print’s Dynamic Marketspace in 2015.” Dr. Davis’s report, although it also contains economic data, is a qualitative analysis of the major trends of the printing industry; it examines the overall economic environment, print sales volumes and profitability of the past decade. The report assesses the relative strengths and weaknesses of different forms of print media, different approaches to business strategy by printing companies and provides a forecast for each through the year 2021.
 After explaining that the overall economy has still to “get out of second gear” following the recession of 2008-2009, Davis says that we should expect only “modest improvement” in the coming period. One of the impacts of the Great Recession is that the recovery is lagging behind previous recessionary cycles by about 4.8% or an average of about 1.2% growth per year. This “recovery gap” means that, at best, we will experience a leveling off or growth plateau that will remain between 2% and 3% into the near future.
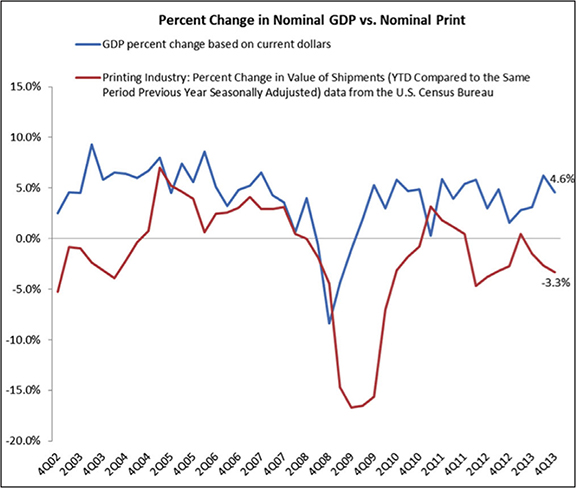
In spite of this less than optimistic view of the economy as a whole, Dr. Davis makes an extremely important point about the relationship of print to GDP. For several years, industry analysts have been pointing to a divergence of printing industry annual growth numbers from the performance of the overall economy. But, according to the PIA report, “print still correlates with the economy.” This means that the impact of the Internet and digital alternatives may not have forced a detachment of print from general economic activity as had been previously thought. It may be the case that the responsiveness of print to GDP has lagged, but its ups and downs still correlate nonetheless.
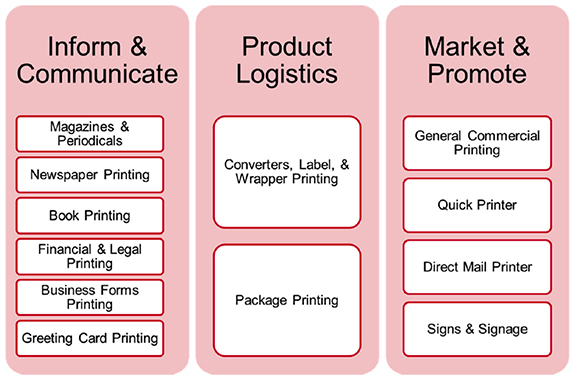
As he has done in the past, Dr. Davis categorizes the functions of print into three groups:
- Inform and Communicate: Publications, Newspapers, Books, Legal Printing
- Product Logistics: Labels, Packaging Printing
- Market and Promote: Direct Mail, Signage
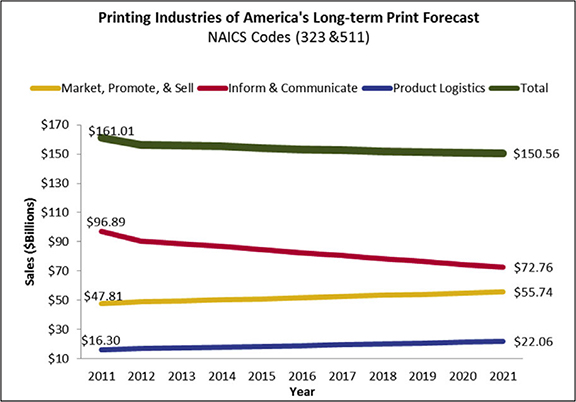
By far, the biggest drain on the printing industry is the first category; Inform and Communicate. The decline in magazine, newspaper and book printing—forms that are most susceptible to digital media alternatives and face dramatic declines in their revenue models—are pulling the rest of the industry down. According to Dr. Davis, this category—with a volume equal to one and a half times that of the other two categories combined—experienced a decline of 2% in 2014 and will see a drop of another 2.5% in 2015.
Meanwhile, Product Logistics—which represents somewhere around one tenth of the total volume of print—experienced an increase of 2.5% in 2014 and is expected to grow another 3% in 2015. According to Dr. Davis, the Market and Promote category is basically flat with a growth of 2% in 2014 and an expected growth of 1% in 2015.
The business trajectory of companies in the industry is another subject that PIA and Dr. Davis have been following for some years. Davis defines the product and service spectrum within the printing industry marketspace in the following four groups:
- Printed Products
- Ancillary and Adjacent Marketspace
- Communications Solutions
- Outsourced Print Management Services
As any given company moves from the top to the bottom of this list, they are migrating further and further away from the attributes of a “commercial printer” and into a more strategic partnership with their clients. Products and services that extend beyond and eliminate the competitive job-by-job bidding process make it possible for firms to develop relationships that add strategic value rather than low cost printing.
Additionally, Dr. Davis’s report contains information from a study of management approaches by printing industry companies that shows those that practice strategic planning have higher profit rates than those that do not.
Finally, the PIA report considers a view of the industry six years out from now. Dr. Davis writes, “We project aggregate U.S. printing shipments to decline from $158.5 billion in 2015 to $143.6 billion in 2021—a reduction of around $15 billion or 9.4 percent. Although this is a fairly substantial decline, it is gradual (about 1.5 percent per year) and even at the end of the forecast period, print’s economic footprint remains large—over $143 billion, making it still one of the largest U.S. manufacturing industries. Additionally, two out of three print functions are expected to grow (print logistics and print marketing/promotion). Only print’s communication/inform function is projected to decline.”
It is clear from the reports published by both of our doctors that the health of the printing industry is improving, if only marginally. While much depends on the overall performance of the economy, print still remains a major manufacturing industry in the US with $155 billion in annual shipments, 45,000 establishments and nearly 1 million employees. As the industry continues to consolidate and shrink, business leaders must respond to the changes being made in customer markets, i.e. shifts in media implementation and segments that are most susceptible to digital alternatives.


