

On February 15, I received an email from Printing Industries of America President and CEO Michael Makin announcing a special report. Mr. Makin said the report “is designed to help you assess the key trends impacting the economy and print markets over the next 12–24 months.” He added that the special report assists companies “design strategies and tactics to help your firm take advantage of coming opportunities and address potential challenges.”
I downloaded “Charting a Path for 2013-2014: A Special Report”—written by PIA Senior Vice President and Chief Economist Dr. Ron Davis—and read it over carefully. Below is a summary of the report followed by a few of my own thoughts and observations.
Economic environment
In the introduction, Dr. Davis points out that the report had to be delayed pending the outcome of the government’s “fiscal cliff” discussion at the beginning of the year. Davis says the debate resulted in a “question mark” on fiscal policy. Therefore the PIA forecast on the economy as a whole is for “restrained expansion as the economy’s natural bias for growth trumps unresolved fiscal policy choices.”
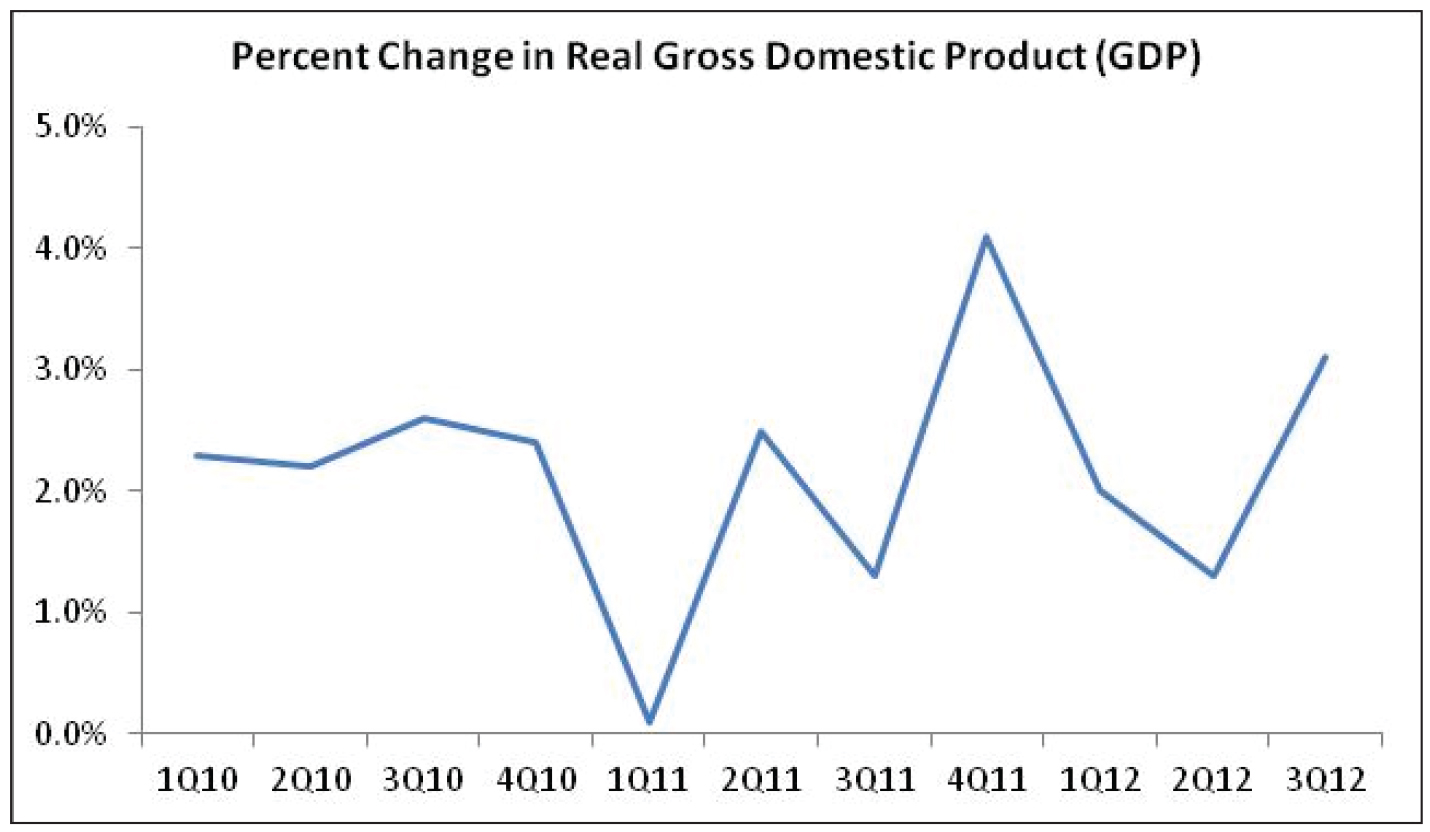 The first section of the report reviews the recent economic past. A chart of “Percent Change in Real GDP” shows a marginally upward trend since the first quarter of 2010, with growth hovering around 2%. Dr. Davis says, “The economy continues to improve, but at a very modest pace … a rate just above stall speed, making the return to recession a distinct possibility.”
Turning to the printing markets, according to the current PIA definition of the industry, it includes “printing and related support activities (Economic Census code 323) plus printing related media (Economic Census code 511).” Based on this, the printing industry represented $158 billion in annual shipments in 2011, there are approximately 48,000 establishments employing over 1 million people. The printing industry is the most geographically dispersed industry in the US with a significant presence in all 50 states. The bad news is that even with this expanded definition of the industry, “establishments and employment have declined for both categories.”
The negative pressures on the printing industry are a combination of a weak economic climate and what PIA calls, “significant challenges from a very competitive environment—both among printers and between print and other media.” At the conclusion of the section on the economy, the report notes a very important transition point, “For the first time ever, marketers spent more on digital advertising than print advertising in 2012.”
Printing firm performance
The second section of the document deals with financial performance during and since the Great Recession of 2007-2009. PIA printing firm data known as the Ratios shows that the industry as a whole exited the recession in 2010 and that trend continued in 2011. The report says, “These results put a hard end to the economic downturn, dispelling fears of the return to recession.”
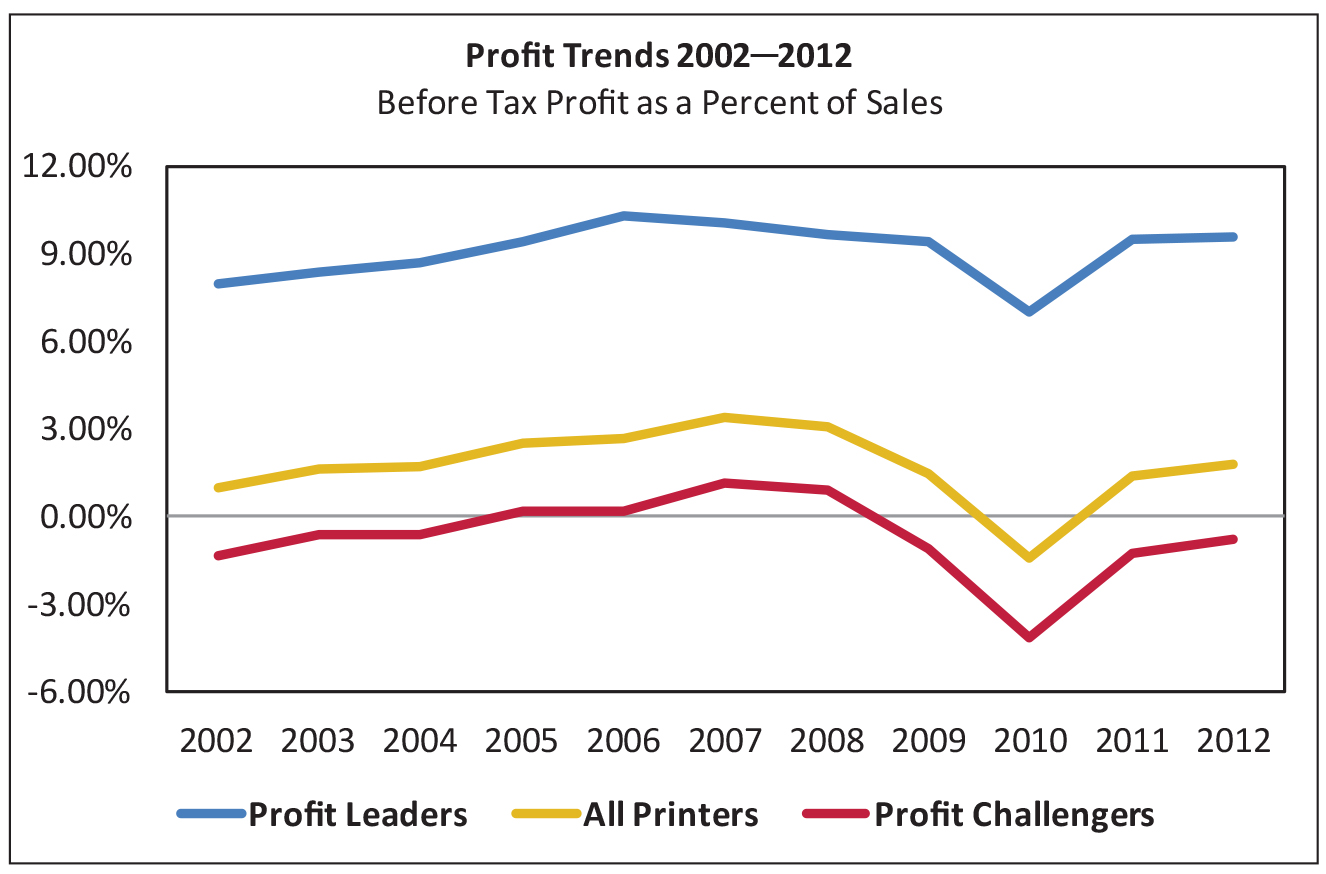 Still, the picture of the past two years is not same for all firms. In 2011, profitability was lowest on average for all small to medium firms (under $10 million in annual sales) and better for larger firms ($10 million and up), but none of the categories were greater than 2.9% profitability. The entire industry has yet to return to pre-recession profitability numbers, even the most successful companies.
Other elements of financial performance focused on changes in major cost items, productivity trends and profitability by product specialty. According to the PIA ratios, industry profit leaders in 2012 “did not experience an increase in productivity … This unexpected result may have occurred due to the Profit Leaders’ slight reduction in the wages paid per employee either dropping slightly or staying the same, which might correlate to more production employees with fewer overtime hours.”
Sales vs. profitability
The third section of the report draws a correlation between sales and profitability. Dr. Davis uses something called a “profile performance quotient” to characterize firms based on demographic and geographic criteria. The quotient is a comparison of the overall industry averages to the particular category average.
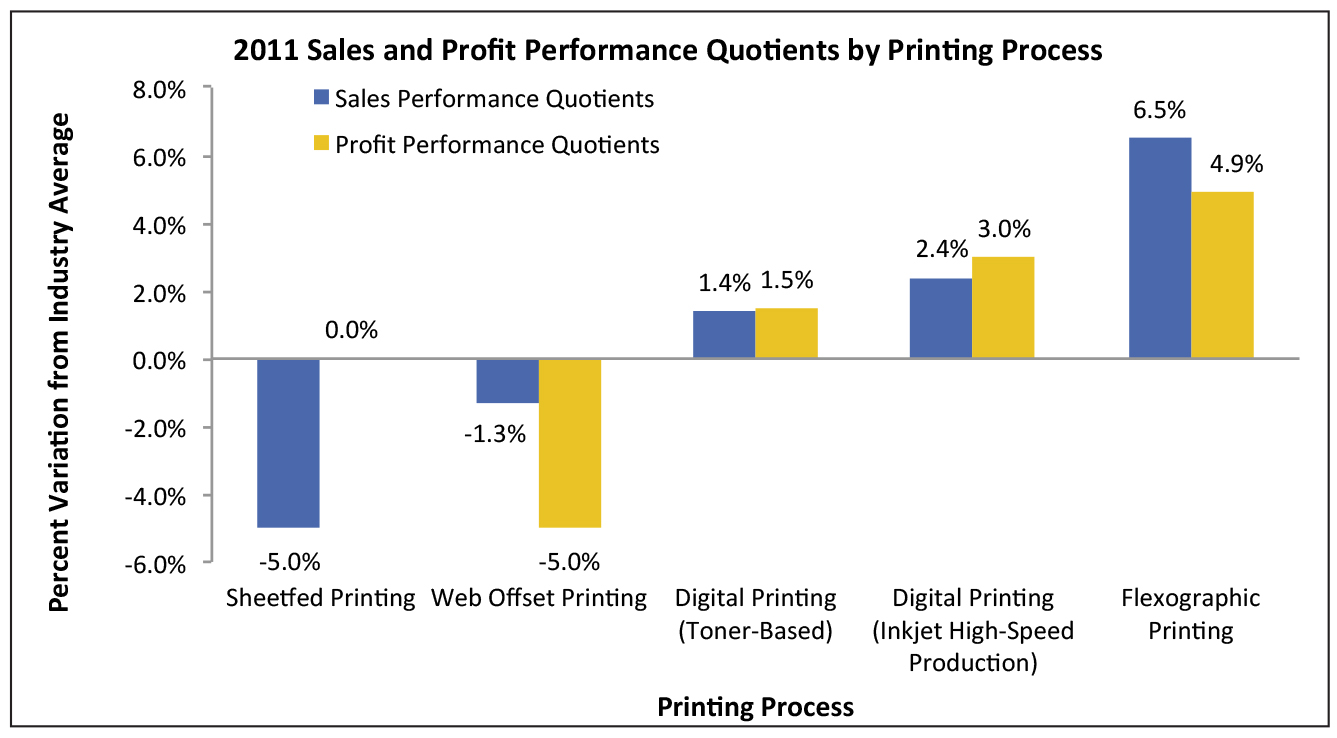 This section shows a clear indication of the sales and profit potential of digital printing (both toner and ink jet based) as well as flexographic printing. It also reveals that the sales and profit performance quotients for both sheetfed offset and web offset were particularly low.
An important finding in the PIA analysis is that “sales and profit performance often track in opposite directions—at least for the demographic characteristics examined. As many printers have discovered, chasing sales may have a negative impact on profit if you don’t keep an eye on other factors that provide a competitive advantage.”
Looking ahead
The last three sections of the report are devoted to: a.) What to expect over the next two years (2013-2014), and b.) What printing firms should be doing now to align themselves strategically with these trends.
The report says that over the next two years the PIA’s forecast “calls for a continuation of the slow economic growth that we have experienced over the past year—around 2 percent adjusted for inflation.” Print related media will continue its steady decline but at a slower rate of 2 percent each year instead of the 4 percent more recently.
According to the PIA the keys to success in the environment over the next two years is the same as it has been over the past few years:
- Know the place of print within the economic cycle
- Know your print segment’s life cycle and competitive environment
- Keep in tune with changes in prices, sales volumes and costs
- Check your strategy against the development of print product function
- Develop your staff and stay focused on “attitude”
The next decade
The concluding section of the PIA forecast goes into a projection for the industry through the year 2021. There are two scenarios presented. Depending on how the industry is defined (either as just “Commercial Printing & Related Support Activities” or this plus “Print-related Media”), the industry is project to either grow in size from $82.8 billion to $89.8 billion or contract from $158.6 billion to $143.6 billion over the next 8 years.
“The reason why adding print-related media into the model causes overall sales to decline is that this sector accounts for 49% of total industry sales and 95% of ‘print-related media’ services the function of print intended to inform and communicate, which is forecasted to decline by 4% per year over the next ten years.”
The bright spots in the decade ahead forecast are in packaging (product logistics print) and print intended to market, promote and sell. In these categories, both economic forecast scenarios show similar growth rates by 2021.
Thinking it through
In my opinion, the PIA’s economic forecast is ambivalent. Perhaps this reflects the contradictory nature of the environment: on the one hand, the recession has reached a “hard end,” but, on the other hand, economic growth will be very slow and uncertain due to the federal budget deficit and the government’s response to these problems. This outlook does not instill a sense of confidence for business owners to take risks when industry profits—even though they are rising—are still below prerecession levels.
Meanwhile, the PIA report shows that opportunities for digital print and media offerings bring promise for printers. Customers are rapidly adding more data driven, mobile and online marketing and communications at the expense of their traditional offset print programs. Printing companies that have found the means to move into these product and service areas and, at the same time, have managed to keep the fixed costs of their offset business under control are well positioned today.
The business environment remains complex: printing firms must continue to navigate the combined impact of slow or stalling overall economic growth and the transition of the industry from traditional to digital systems, products and services. The PIA report provides important insights into this process.
