PE and “The Internet of Things”

BooksLoRes

In our modern world of wireless mobile connectivity, print can be viewed as a uniquely analog and peculiarly offline media; as compared to digital, print is distinctly unconnected, static and isolated. As a form of visual communications, print is the penultimate monomedia. It is dependent upon typography and its linear consumption, i.e. left to right (in the West), top to bottom. Print is the antithesis of hypermedia.

Look at your bookshelf; each book is a veritable communications island “entire of itself.” Even with tables of contents and indices (indexes), our printed books are hyperlink deprived; and, though they sit next to and touch each other, they cannot “connect.”

Taking a longer view, ink-on-paper media is the legacy of industrial era communications technology in the digital age. In the future, as Benny Landa explained at DRUPA2012, mankind will no longer communicate by “smearing pigment onto crushed trees.”

What’s that? This is a very one-sided viewpoint. What about the unique properties of paper and print that no digital and mobile media can replicate? What about the dimensional and tactile elements of the print media experience? What about the environmental benefits of paper-based products? Yes, these are valid arguments against the supremacy of digital over analog media.

Alongside these great features of print, there is another aspect that is either misunderstood or unknown. Conventionally speaking, print is not a form of electronics; but, in a very profound sense, electronics is actually a form of print. From the earliest days of the electronics revolution, printing methods were used to design and manufacture transistors, integrated circuits and microprocessors. From the beginning of the digital age, photolithography and photoengraving techniques were used to make semiconductors.

MooreNoyceGroveatIntel
Gordon Moore, Robert Noyce and Andy Grove at Intel with a microprocessor mask in 1978.

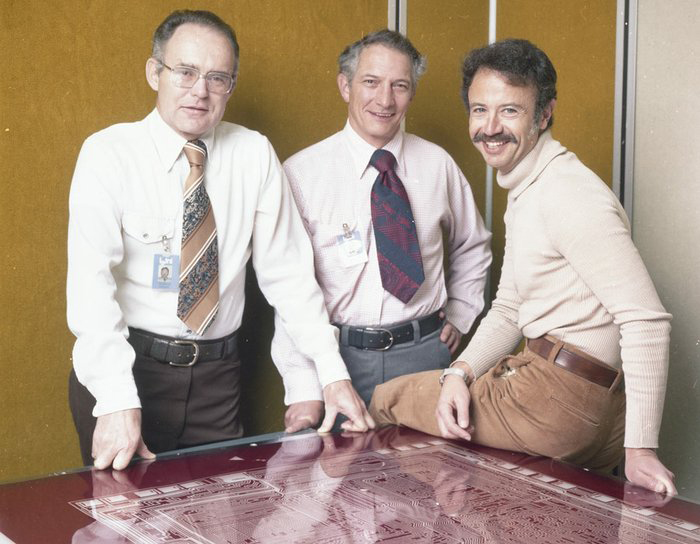
In fact, the pioneers of electronic devices—including Robert Noyce and his team of physicists and chemists at Fairchild Semiconductor, who invented the microchip, and later at Intel, who invented the microprocessor—used the same techniques that printers used to prepare plates for press. Light tables, ruby masks, cameras and film were the standard tools of the electronics industry in Silicon Valley throughout the 1950s, 60s and 70s. And photolithography methods still remain critical steps in sectors of the electronics industry to this day.

While many of the most modern and sophisticated electronics components such as CPUs have moved beyond their photoengraving roots—mainly due to limitations of scale—the relationship between these technologies has continued to evolve. Over the past decade, printed electronics (PE) has become a new and promising merger of these two seemingly opposed disciplines.

PE is the production of electronic components—displays, memory, batteries and sensors—by applying layers of conductive and nonconductive inks onto plastic, cloth or paper. PE uses many of the same methods that are familiar in commercial printing: screen printing, flexography, gravure, offset lithography and inkjet.

Although it is still in the early stages of development, PE is being driven by the promise of significant cost savings. Electronics manufacturing requires precision placement of layers of conductive material in intricate patterns. With previous photoengraving methods, which are subtractive, multiple steps are required to create each layer and much of the material is etched away and unused during the process. With PE, an additive process, each layer is created in as few as two steps—printing and curing—and all of the applied conductive material gets used.

PEProducedRFIDTag
RFID tag produced with PE

One practical example of PE is printed radio frequency identification (RFID) tags. RFID is a wireless system that uses radio-frequency fields to transfer data from a tag on an object to a reading device for automatic identification and tracking. RFID tags made with conventional silicon manufacturing methods can cost as much as $25 each. These devices are being currently used widely in the logistics and retail industries at the container level.

The expectation is that PE will bring the cost of RFID tags down to one cent or a fraction of one cent. Once this is accomplished, nearly every object produced can have its 2D barcode replaced with an RFID tag. Imagine being able to go to the market, load up your shopping cart and—without stopping at the checkout—have your account billed for your purchases and wheel that buggy right out to your car. What a time saver!

There are many other applications of PE in research and development. The advancements in conductive ink technologies, along with the microscopic precision in their application to substrates with PE, raises the possibility that every object in the world can be made into a “smart” object that is capable of interactivity and data collection.

KevinAshton
Kevin Ashton with an RFID tag: “The Internet of Things has the potential to change the world.”

The proliferation of smart sensors such as RFID tags and other wireless electronic devices is connecting objects to one another and to the Internet in the tens of billions. Kevin Ashton, the technology pioneer who came up with the phrase “The Internet of Things,” wrote the following about this phenomenon in 2009, “We need to empower computers with their own means of gathering information, so they can see, hear and smell the world for themselves, in all its random glory. RFID and sensor technology enable computers to observe, identify and understand the world—without the limitations of human-entered data. … The Internet of Things has the potential to change the world, just as the Internet did. Maybe even more so.”

So, in our brave new world of wirelessly connected objects, printed electronics has a very important role to play, especially in package and label production. As it turns out, print is actually becoming a most electronic and connected media. Perhaps, with the application of printed electronics to replace ISBN barcodes and the Dewey Decimal System labels, even the books in our analog libraries will be able to interact with each other after all.

2013: A big year for Big Data

The year 2013 will be important for a couple of reasons. Believe it or not, 2013 marks the twentieth anniversary of the World Wide Web. It is true that Tim Berners-Lee developed the essential technologies of the web at CERN laboratory in Switzerland in 1989-90. However, it was the first graphical browser called Mosaic—developed by a team at the National Center for Computer Applications at the University of Illinois-Urbana—in April 1993 that made the web enormously popular.

ncsa-mosaic

Marc Andreessen, developer of the first graphical web browser Mosaic in 1993.
Marc Andreessen, developer of Mosaic the first graphical web browser in 1993.

Without Mosaic, brainchild of UI-U NCSA team member Marc Andreessen, the explosive growth of the web in the 1990s could not have happened. Mosaic brought the web outside the walls of academia and transformed it into something that anyone could use. In June 1993 there were only 130 web sites; two years later there were 230,000 sites. In 2007 there were 121 million web sites; it is estimated that there are now 620 million web sites. Now that qualifies as exponential growth.

This brings me to the second reason why this year is important: worldwide digital information will likely surpass 4 zettabytes of data in 2013. This is up from 1.2 zettabytes in 2010. Most of us are familiar with terabytes; a zettabyte is 1 billion terabytes. In between these two are petabytes (1 thousand terabytes) and exabytes (1 million terabytes). 2013 is going to be a big year for Big Data.

Companies that grew up in the age of the World Wide Web are experts at Big Data. As of 2009, Google was processing 24 petabytes of data each day to provide contextual responses to web search requests. Wal-Mart records one million consumer transactions per hour and imports them into a database that contains 2.5 petabytes. Facebook stores, accesses and analyzes 30+ petabytes of user-generated data.

DataTerms

The expansion of worldwide Big Data and the metric terms to describe it (yottabytes or 1,000 zettabytes are coming next—beyond that is TBD) has become the subject of much discussion and debate. Big Data is most often discussed in terms of the four V’s: volume, velocity, variety and value.

Volume

The accumulation of Big Data volume is being driven by a number of important technologies. Smartphones and tablets and social media networks Facebook, YouTube and Twitter are important Big Data sources. There is another less visible, but nonetheless important, source of Big Data: it is called the “Internet of Things.” This is the collection of sensors, digital cameras and other data gathering systems (such as RFID tags) attached to a multitude of objects and devices all over the world. These systems are generating enormous amounts of data 24/7/365.

Velocity

The speed of Big Data generation is related to the expansion and increased performance of data networks both wired and wireless. It is also the result of improved capturing technologies. For example, one minute of high definition video generates between 100 and 200 MB of data. This is something that anyone with a smartphone can do and is doing all the time.

Variety

The Big Data conversation is more about the quality of the information than it is about the size and speed. Our world is full of information that lies outside structured datasets. Much of it cannot be captured, stored, managed or analyzed with traditional software tools. This poses many problems for IT professionals and business decision makers; what is the value of the information that is largely “exhaust data”?

Value

There are good internal as well as external business reasons for sharing Big Data. Internally, if exhaust data is missed in the analytical process, executives are making decisions based upon intuition rather than evidence. Big Data can also be used externally as a resource for customers that otherwise would be unable to gain real-time access to detailed information about the products and services they are buying. It is the richness and complexity of Big Data that makes it so valuable and useful for both the executive process and customer relationships.

Every organization today is gathering Big Data in the course of its daily activities. In most cases, the bulk of the information is collected in a central EMS or ERP system that connects the different units and functional departments of the organization. But more likely than not, these systems are insufficient and cannot support all data gathering activities within the organization. There are probably systems that have been created ad-hoc to serve various specialized needs and solve problems that the centralized system cannot address. The challenge of Big Data is to capture all ancillary data that is getting “dropped to the floor” and make it useful by integrating it with the primary sources.

Making Big Data available offers organizations the ability to establish a degree of transparency internally and externally that was previously impossible. Sharing enables organization members and customers to respond quickly to rapidly changing conditions and circumstances. Some might argue that sharing Big Data is bad policy because it allows too much of a view “behind the curtain.” But the challenge for managers is to securely collect, store, organize, analyze and share Big Data in a manner that makes it valuable to those who have access and can make use of it.

I remember—upon downloading the Mosaic browser in 1993 with my dial up connection on my desktop computer—how thrilling it was to browse the web freely for the first time. It seemed like Mosaic was the ultimate information-gathering tool. I also remember how excited I was to get my first 80 MB hard disk drive for data storage. The capacity seemed nearly limitless. As we look back and appreciate the achievements of twenty years ago, we now know that those were really the beginnings of something enormous that we could not have fully predicted at the time.

With the benefit of those experiences—and many more over the past two decades of the transition from analog to online and electronic media—it is important to comprehend as best one can the meaning of Big Data in 2013 and where it is going. Those organizations that recognize the implications and respond decisively to the challenges of the explosive growth of structured and unstructured data will be the ones to establish a competitive advantage in their markets.

Graph Expo & DMA2012: A tale of two shows

Both the premiere print trade show and the top direct marketing conference were held in October this year. I had the fortunate opportunity to attend these two shows back to back: Graph Expo in Chicago on October 7-10 and DMA2012 in Las Vegas on October 13-18. As I walked the exhibit spaces and attended meetings, presentations and other gatherings, I saw important similarities and differences between these two events. Each in their own way illustrated how the graphic arts and direct marketing industries are being impacted by digital, social and mobile media technologies. They also revealed the complexities and difficulties facing every organization in our era of data-driven marketing and communications.

The mood among presenters, exhibitors and attendees at both shows was one of cautious optimism. The ongoing perfect storm of economic downturn combined with rapid technological change was on everyone’s mind. Both shows were devoted to providing answers and solutions to the pressing problem of the day; how can business owners and decision makers achieve success by more effectively serving client needs.

One way to compare these events is to look at the numbers. Since the figures for the 2012 shows have not yet been published, I will use the numbers from last year:

Event              Attendees      Exhibitors    Conf. Sessions
Graph Expo      20,000+          490+            50+
DMA2011         8,500+           350+            200+

With an emphasis on technology demonstration, Graph Expo is primarily about the equipment needed to accomplish marketing and communications objectives. And with an emphasis on conference sessions, DMA2012 (Direct Marketing Association) is focused on programs that educate and inform its audience about the processes needed to prepare and analyze initiatives. GraphExpo is for service companies that buy systems for the execution of programs. DMA2012 is for marketing companies that buy tools and solutions for the conceptualization of programs. Taken together, the two represent a continuum of the entire marketing and communications loop; where the one ends the other picks up.

These characteristics can also be seen by the way the event organizers describe themselves to their audience:

Graph Expo: “Graph Expo is the year’s largest and most exciting display of ‘live’ running equipment in the Americas. Watching a machine run and participating in a demonstration teaches you things you just can’t learn by sitting in a conference room or looking at a brochure. This show is a problem-solving adventure designed to help you make informed purchasing decisions.”

DMA20212: “The content at DMA2012 will deliver real-world solutions you can use immediately, as well as strategic guidance to help you plan for 2013. You’ll find an inspiring line-up of key thought leaders and innovators from the world’s leading companies. These gurus will educate and inform you on the latest trends:

  • optimizing content across channels
  • monetizing social media
  • integrating media according to customer preference
  • leveraging real-time analytics for daily decision making”

I arrived at Graph Expo on Sunday, October 7 and entered the expo floor when it opened at noon. Along with everyone else, I noticed immediately the prominence of the manufacturers of digital printing technologies, as was the case in last year’s show. Canon, Xerox, HP, Fuji, Kodak and others have taken over the largest booths in the show. In previous years, these booths were occupied by Heidelberg, KBA, Komori and Mitsubishi. Although Heidelberg stood out by having a large space with many machines on display, gone are the days of GraphExpo as a showcase of large and loud offset printing machinery.

Benny Landa speaking at the InfoTrends breakfast at GraphExpo

On Monday morning October 8, I attended an InfoTrends breakfast meeting that featured a talk by Benny Landa, the inventor of digital printing (he launched the Indigo press in 1993). Landa spoke about what he called the “economic depression of the printing industry.” As he reviewed the new printing technique his company has developed (nanography), he explained that the “98% of the printing being done today” is static, non-variable data printing. Since much of this printing is not profitable, it means that printing companies are unable to invest in new technologies.

Chris Anderson delivering the opening keynote at DMA2012

My visit to the DMA2012 Conference began by attending the opening keynote on Monday, October 15. The featured speaker was Chris Anderson, editor of Wired magazine and author of the business book “The Long Tail.” Anderson spoke about the implications of “big data” for marketing organizations. Big data is the ever-growing mountain of information about our lives; companies like Google and Facebook are accumulating big data about our online and offline activities, preferences and habits. The challenge facing marketers is how best to use this information since it is not structured and does lend itself to traditional analytical tools and methods. Anderson said that big data is a challenge to traditional marketing models.

From this brief report, it is evident that we are passing through an exciting time in our industry; we are well into the transition from the traditional, analog world of yesterday to the data-driven, digital world of tomorrow. However, the path forward is not obvious; marketing organizations and their service providers are facing a multiplicity of challenges. Among the keys to success in this rapidly shifting environment is taking advantage of events like Graph Expo and DMA2012. In this way, we can grasp the fundamental trends of development, learn from our peers and prepare our own organizations to meet the new demands of our clients.